Question
N5 Physics 2022 paper 1, question 2
The diagram shows a toy car at rest at the top of a slope.
The car is released and travels with a constant acceleration down the slope.
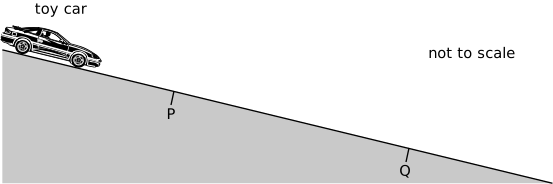
Which row in the table could show the speed of the toy car at P, the speed of the toy car at Q, and the average speed of the car between P and Q?
| Speed at P (ms−1) |
Speed at Q (ms−1) |
Average speed between P and Q (ms−1) |
|
|---|---|---|---|
| A | 0 | 2 | 1 |
| B | 1 | 1 | 1 |
| C | 1 | 3 | 2 |
| D | 2 | 3 | 2 |
| E | 2 | 3 | 4 |
1 mark